One of the central plugins for many of the MOLGENIS databases is the data explorer. As the name suggests this is the plugin to use if you wish to take a close look at your data.
Note that some of the components described below are only shown if they are enabled in the application settings and to people with the appropriate permissions.
Select entity
At the top left corner of the data explorer, the name of the currently selected entity is shown, as well as the description (if given).
At the top right corner, a dropdown (entity select) is shown which can be used to select the entity you wish to display. For admins, a delete button is shown at the right side of the entity select. Clicking it will allow you to choose if you only want to delete the data or also want to delete the metadata for the currently selected entity.

Search/Filter
In the upper left corner of the data explorer, below the name of the entity, a search box is shown. This search box can be used to search all your data for a certain search term.

Directly below the search box, the currently active attribute filters are shown. They can be edited by clicking on them. The cross trailing can be used to delete the currently used filter(s). Filters can be set from the attribute selection tree which is described below. Using the checkbox in front of each attribute, the visibility of this attribute in the table can be managed. The filter icon can be used to set filters for this specific attribute.

In the area with the active filters, you will also find the button to open the filter wizard. This is a popup screen that allows you to add filters for different attributes in one go.

Different views

The data explorer consists of multiple modules to view or process the data in different ways. These modules are described below:
Data table
The data module shows the data in a table. This table can be sorted by clicking on the headers. If your data contains references to other entities, an icon is shown to expand this reference to show the data from the referenced entity.
Every line starts, depending on your permissions, with some action icons:

- Add row: Using this button, a form will open with input for all the attributes in the entity, allowing you to create a new row. All fields will be validated based on their datatype. For example, "test" is not a valid email address.
- Edit row: Same as the add row button, but with prefilled inputs to allow you to edit a row.
- Inspect row: This button will open a form with a custom made report for this row. With the right permissions, different reports can be created using the FreemarkerTemplate entity.
- Delete row: This button can be used to remove a row from the entity.
Metadata editing (Since MOLGENIS 2.0)
A new feature of MOLGENIS 2.0 is the "Metadata editing capabilities". All data, including metadata, can be created, read, updated and deleted, with certain restrictions. The metadata editing capabilities will be discussed in this part of the documentation.
Metadata main entities
There are three main metadata entities. These entities contain all info about the entities, attributes and packages in MOLGENIS, respectively EntityType, Attribute and Package.
EntityType
EntityType contains all data about the entities in MOLGENIS. Each row in this table represents an entity in MOLGENIS.
Editing capabilities
- Create:
- Yes, when metadata is configured correctly in the EMX and is loaded via the data uploader.
- An entity cannot be created via the forms.
- Read:
- Yes
- Update:
- Updatable fields:
- Label
- Description
- Abstract
- Tags
- i18n fields
- Updatable fields:
- Delete:
- Possible for non-system entities.
Attribute
Attribute contains all data about the attributes in MOLGENIS. Each row in this table represents one attribute of one MOLGENIS entity.
Editing capabilities
- Create:
- Yes, for non-system entities.
- NOTE: When creating an attribute for an existing enitity, the option Nillable cannot be set to true.
- Read:
- Yes
- Update:
- Yes, for non-system entities:
- Updatable fields:
- Sequence number
- Data type (See "conversion list of data types")
- ID attribute
- Label attribute
- Lookup attribute index
- Attribute parent
- Attribute parts
- Referenced entity
- Order by
- Expression
- Nillable
- Auto
- Visible
- Label
- Description
- Aggregateable
- Enum values
- Range min
- Range max
- Read-only
- Unique
- Tags
- Visible expression
- Validation expression
- Default value
- i18n fields
- Delete:
- Yes, for non-system entities
Conversion list of data types
This list describes the allowed conversion of data types in the metadata edit, and also some extra info and motivation.
BOOL
- Allowed:
- STRING
- TEXT
- INT
DATE
- Allowed:
- STRING
- TEXT
- DATE_TIME
- Tip:
- If you want to do something with your dates, convert them to STRING first and later to another data type.
DATE_TIME
- Allowed:
- STRING
- TEXT
- DATE
INT
- Allowed:
- STRING
- TEXT
- DECIMAL
- LONG
- BOOL
- ENUM
- XREF
- CATEGORICAL
- Tip:
- Conversion to SCRIPT or HTML can be done using the STRING route.
LONG
- Allowed:
- STRING
- TEXT
- INT
- DECIMAL
- ENUM
- XREF
- CATEGORICAL
- Tip:
- Conversion to SCRIPT or HTML can be done using the STRING route.
DECIMAL
- Allowed:
- STRING
- TEXT
- INT
- LONG
- ENUM
- Tip:
- Conversion to SCRIPT or HTML can be done using the STRING route.
- Allowed:
- STRING
- TEXT
- XREF
- CATEGORICAL
- Tip:
- EMAIL format can never be numeric or a date.
- XREF or CATEGORICAL are a far better alternative for ENUMs.
HYPERLINK
- Allowed:
- STRING
- TEXT
- XREF
- CATEGORICAL
- Tip:
- HYPERLINK format can never be numeric or a date.
- XREF or CATEGORICAL are a far better alternative for ENUMs.
HTML
- Allowed:
- STRING
- TEXT
- SCRIPT
- Tip:
- If HTML is properly used, you won't be able to convert it to anything else but text or script.
CATEGORICAL
- Allowed:
- STRING
- INT
- LONG
- XREF
- Tip:
- IDs can only be of type STRING, INT, LONG, EMAIL and HYPERLINK.
XREF
- Allowed:
- STRING
- INT
- LONG
- CATEGORICAL
- Tip:
- IDs can only be of type STRING, INT, LONG, EMAIL and HYPERLINK.
MREF
- Allowed:
- CATEGORICAL_MREF
CATEGORICAL_MREF
- Allowed:
- MREF
SCRIPT
- Allowed:
- STRING
- TEXT
STRING
- Allowed:
- BOOL
- DATE
- DATE_TIME
- DECIMAL
- INT
- LONG
- HTML
- SCRIPT
- TEXT
- ENUM
- COMPOUND
TEXT
- Allowed:
- BOOL
- DATE
- DATE_TIME
- DECIMAL
- INT
- LONG
- HTML
- SCRIPT
- STRING
- ENUM
- COMPOUND
ENUM
- Allowed:
- STRING
- INT
- LONG
- TEXT
COMPOUND
- Allowed:
- STRING
FILE
- Allowed: NONE
ONE_TO_MANY
- Allowed: NONE
Package
Package contains all data about the packages in MOLGENIS. Each row in this table represents a package in MOLGENIS.
Editing capabilities
- Create: Yes
- Read: Yes
- Update: Yes, for non-system entities
- Label
- Description
- Tags
- Delete:
- Yes, for non-system entities
Important!Deleting a package will result in deleting all children (packages entities and attributes).
System packages, system entities and system attributes
System packages, system entities and system attributes are available in MOLGENIS 2.0 after installation. They are configured programmatically and can only be changed in new releases of the software. Changing the system packages, system entities and system attributes via the metadata editing functionality, will be registerd in the database and update MOLGENIS (not the java part). When dropping the index and database, this registration will be dropped, and the original values will be loaded again.
Download
At the bottom right of each table, there is a download button. This button allows you to save the data to a CSV or XLSX file. Depending on the purpose of the download, identifiers or labels can be used as column headers. Probably the data is safest inside molgenis! Another button, next to the download button, will allow you to send your data to a galaxy server.

Genome browser

If a specific entity has a chromosome and position attribute, the genome browser will be shown. The browser used by MOLGENIS is the Dalliance genome browser. By clicking on a row in the table, the genome browser will zoom on the coordinates of that row. A button ('apply filters') is available at the bottom of the genome browser, to filter the table based on the coordinates that are currently shown in the genome browser.
Try it out
Upload the vcf_example_file using the importer. Let's select an entity containing genomic variants, by selecting the entity name you just chose for the upload in the entity select. Let's assume we have a specific location we are interested in, say position 103214569 at chromosome 7. We'd like to search for that specific line in the entity. Let's first use the search box to see if we can find the line that way: enter "103214569" in the search box and press enter.
But now we like to take a look at all variation on chromosome 7. As you can imagine searching for "7" in all the attributes in the data, will give us a lot of results we are not looking for. So we'd like to filter for this value specifically for the chromosome attribute.
Click on the filter icon in front of "#CHROM" in the attribute selection tree, and enter "8" in the input field. Then click "apply". However, we meant to search for chromosome 7, so let's click the filter in the active filters box, and change the value to 7. We now have all the values for chromosome 7 in the table, however, the results are divided over several pages of results. We'd like to view them all in one screen; click the "rows per page" dropdown below the table, and select "100". This will show 100 results per page. The "FILTER" column shows the same value for every line. Since we are not interested in this column, let's hide it by clicking the checkbox in front of "#CHROM" in the attribute selection tree.
Click any column header in the table to sort the data based on that column, click again to sort in the opposite direction. Click one of the lines in the table to zoom to the position of this variant in the genome browser. Click the symbol in front of the "SAMPLES" column header to show the columns belonging to the samples.
Click the magnifying glass in front of the dataline, to show a report for that line. The default report just shows all attribute values in a structured way. However, as stated above, all kinds of reports can be added at runtime.
Inline editing
Click the edit icon and change the chromosome from 7 to 8 and save. Adding a row works the same way, only without the prefilled fields. Now, let's click the red garbage bin icon in front of a line to delete this line from the entity.
TODO: add figure
Annotators
The annotator module of the data explorer is the user interface to use the MOLGENIS annotator framework, which can also be used from the command-line. The annotator framework is a system to add data from other resources to your genomic entities. For example pathogenicity prediction, allele frequencies and phenotype information.

The screen shows a list of available annotators that can be used. Clicking the title of the annotator will result in a popup with additional information, such as a general description and a listing of the attributes that will be added by this annotator. Using the checkboxes, multiple annotators can be selected for one run, which is started by clicking the "annotate" button. If preferred, a copy of the dataset can be created with the annotations added to this copy, leaving the original entity as it is. Annotated fields will be added to the entity in a compound attribute.
On the right hand side of the screen, a list of unavailable annotators is shown. The reason why they are unavailable is shown in this list. This can for example be due to a resource being unavailable, or when an attribute needed to map the entity and resource to each other is missing. The gear icon trailing every annotator in the list, can be used to configure the settings for this annotator.
Aggregation
The aggregation module allows you to produce aggregated counts for queries on the data.
The screen has 2 areas, the controls and the results. The controls allow you to choose the attributes you wish to use for the aggregation.

Youcan select 1 attribute for simple one dimensional counts, represented as a table with one column, or two attributes to get a 2 dimensional aggregate table. A third dropdown allows you to select an attribute by which to group the results.

These functionalities are best explained by the example in the "try it out section below".
try it out
Upload emx_example_file through the importer. Navigate to the data explorer and select the aggregates tab. Select the just uploaded "biobanks" entity.
Now select "patientid" in the entity dropdown. You now get a 1 dimensional list of counts, showing you that every patient has 3 entries in the selected entity.
Now select "biobank" in the first aggregate dropdown, and in the second select "sampletype". You now get a table representing the amount of samples in both biobanks per type.
Finally, select "patientid" in the third dropdown, the distinct attribute. The table will update to show you how many patients with at least one sample of a specific type are available in a biobank.
Charts
For the chart capabilities of MOLGENIS we use the Highcharts library.
MOLGENIS currently offers two types of plots for your data, the scatter plot and the box plot.

scatter plot Scatter_plot

For the scatterplot, 2 attributes are selected to make the plot. Optionally, a third attribute can be selected to split the dots in groups, using different shapes and colours per group. You can also provide a title for your plot.

box plot Box_plot

For the box plot, 1 attribute (feature) is to be selected to make the plot. Optionally, a second attribute can be selected to split the dots in groups. You can also provide a title for your plot.

Reports
The reports functionality is made for overriding the default instance view or to add an instances tab in the Data-explorer. Overriding the views or adding a tab is possible by creating a new FreemarkerTemplate entity with the right name convention. This short tutorial will show you how to achieve this.
There are two ways to create your own reports:
- Overriding the default instance view.
- Add one or more instances view tabs.
You will need:
- A data set: "Advanced data example" (download). Upload this dataset into your MOLGENIS instance, see the Upload guide.
Override the entity view
Steps:
- Go to the Data Explorer.
- Select the "cities" entity via the entity select dropdown.
- The entity view modal is opened when you click on the
 button".
 - The default view will be:

- Let's upload our own template.
a. Go to the data explorer and select the FreemarkerTemplate entity.
b. Click on the
 button. In the modal you fill in:
 * Name: view-entityreport-specific-root_hospital_cities.ftl (view-entityreport-specific-\<Full entity name>.ftl)
 * Value: "\<div>City name: ${entity.get('cityName')}\</div>"
- Repeat steps 2 and 3.
- The new view will be:

Add an instances view tab
- Go to the data explorer and select the "cities" entity through the entity select dropdown.
- Let's upload our own template.
a. Go to the data explorer and select the FreemarkerTemplate entity.
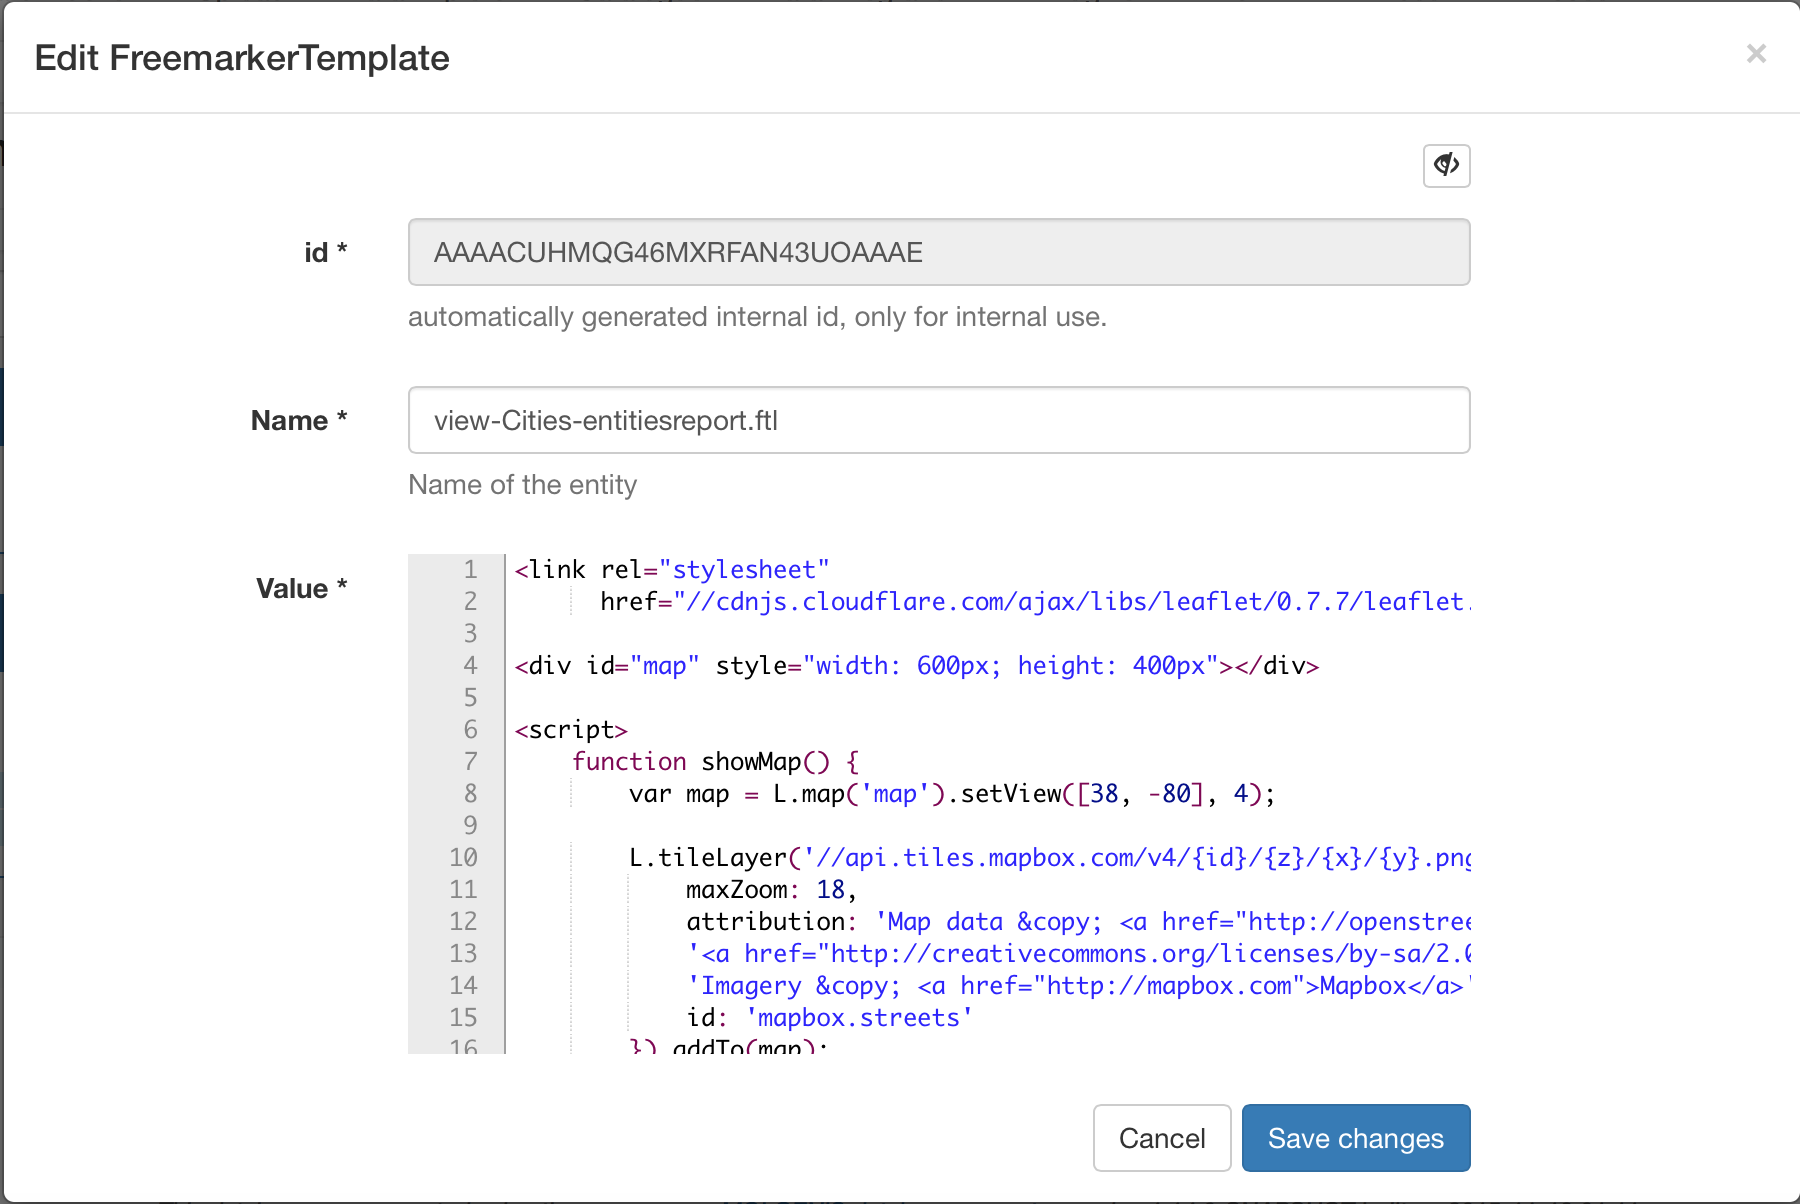
b. Click on the button. In the modal you fill in:
Name: view-Cities-entitiesreport.ftl (view-<template name>-entitiesreport.ftl)
Value:
<link rel="stylesheet"
href="//cdnjs.cloudflare.com/ajax/libs/leaflet/0.7.7/leaflet.css"/>
<div id="map" style="width: 600px; height: 400px"></div>
<script>
function showMap() {
var map = L.map('map').setView([38, -80], 4);
L.tileLayer('//api.tiles.mapbox.com/v4/{id}/{z}/{x}/{y}.png?access_token=pk.eyJ1IjoibWFwYm94IiwiYSI6IjZjNmRjNzk3ZmE2MTcwOTEwMGY0MzU3YjUzOWFmNWZhIn0.Y8bhBaUMqFiPrDRW9hieoQ', {
maxZoom: 18,
attribution: 'Map data © <a href="http://openstreetmap.org">OpenStreetMap</a> contributors, ' +
'<a href="http://creativecommons.org/licenses/by-sa/2.0/">CC-BY-SA</a>, ' +
'Imagery © <a href="http://mapbox.com">Mapbox</a>',
id: 'mapbox.streets'
}).addTo(map);
<#list datasetRepository.iterator() as city>
L.marker([${city.get("lat")},${city.get("lng")}]).addTo(map)
.bindPopup("${city.get("cityName")}").openPopup();
</#list>
}
$.getScript("//cdnjs.cloudflare.com/ajax/libs/leaflet/0.7.7/leaflet.js", showMap);
</script>
Click on the settings icon
 a. Check: Modules -> Data -> Reports -> Yes
b. Set: Reports -> Reports -> root_hospital_cities:Cities
a. Check: Modules -> Data -> Reports -> Yes
b. Set: Reports -> Reports -> root_hospital_cities:Cities* root_hospital_cities is the entity name. * Cities is the template name.
- Refresh the page and repeat step 1.
- The result:

Model registry
The model registry is a module that can display the entire meta data model of a data set. This means that you do not look at the actual data, but you can see how the data is modelled. This is useful for detecting errors in your model, or if you want to base your own model on something that already exists.

The following paragraphs will explain how the model registry works, but it is more fun to learn how it works with some actual models. So for this part, you can go to The BioMedBridges website, and navigate to the model registry module. You do not even have to log in!
Now that we have some actual models on our screen, let's get started by finding some models. I know! Why don't we search for the EMX model? You should be familiar with it since you probably imported your own data already. In the main model registry screen, search for EMX. You should get one model back, namely emx (Entity Model eXtensible). As you can see, there are a few links mentioned as well. These are Tags, if you do not know the term, I suggest you look at the Upload guide again. The label beneath the Tags tells you why this model was returned for your search.
This part is not telling us much about the content of the EMX model yet, so let's see what it holds! Click the View Model Details button to get to the details page.

Here, you can see a tree on the left and a large middle section containing all the meta data. You can also view an UML diagram of your entire package, and even print out a document containing the overview of your model.
The tree
The tree is a simplified overview of all the tables, or entities, inside a package. Clicking on the Molgenis Field Types entity for example, will take you to the detailed description of that entity. You can also expand an entity, to see all its attributes. Clicking an attribute will take you to the description of that attribute.
The details
The details for every entity and attribute is an overview of data types, constraints, default values, and descriptions.
UML Navigate to the UML tab to see a UML representation of your model. You can zoom in and out using the + and - buttons. You can also drag around the different boxes to rearrange the diagram.
Printing You can print your model to review it on paper, by pressing the print button at the top right of the screen.